Employment of Computer and Information Research Scientists by state
The U.S. Bureau of Labor Statistics publishes National Industry-Specific Occupational Employment and Wage Estimates.
The BLS estimated 24,580 persons were employed as “Computer and Information Research Scientists” in 41 states. The employment occupation code is 15-1111.
52 percent of all jobs were in 5 states: California, Virginia, Maryland, Texas and Massachusetts.
| State | Employment | Percent |
| California | 4,440 | 18.1% |
| Virginia | 3,360 | 13.7% |
| Maryland | 2,100 | 8.5% |
| Texas | 1,660 | 6.8% |
| Massachusetts | 1,480 | 6.0% |
| New Jersey | 1,010 | 4.1% |
| Washington | 960 | 3.9% |
| Pennsylvania | 950 | 3.9% |
| New York | 840 | 3.4% |
| Illinois | 790 | 3.2% |
| Florida | 730 | 3.0% |
| Ohio | 720 | 2.9% |
| Georgia | 670 | 2.7% |
| Alabama | 560 | 2.3% |
| Colorado | 360 | 1.5% |
| Rhode Island | 360 | 1.5% |
| North Carolina | 290 | 1.2% |
| Arizona | 280 | 1.1% |
| District of Columbia | 280 | 1.1% |
| Mississippi | 270 | 1.1% |
| Utah | 270 | 1.1% |
| Connecticut | 240 | 1.0% |
| Tennessee | 220 | 0.9% |
| South Carolina | 210 | 0.9% |
| New Mexico | 190 | 0.8% |
| Michigan | 170 | 0.7% |
| Minnesota | 170 | 0.7% |
| Oklahoma | 150 | 0.6% |
| Missouri | 100 | 0.4% |
| Wisconsin | 100 | 0.4% |
| Idaho | 90 | 0.4% |
| Delaware | 80 | 0.3% |
| Hawaii | 80 | 0.3% |
| Kansas | 70 | 0.3% |
| Arkansas | 60 | 0.2% |
| New Hampshire | 60 | 0.2% |
| Oregon | 60 | 0.2% |
| Nebraska | 50 | 0.2% |
| Louisiana | 40 | 0.2% |
| Iowa | 30 | 0.1% |
| South Dakota | 30 | 0.1% |
| Indiana | no estimate | |
| Kentucky | ||
| Maine | ||
| Montana | no data | |
| Nevada | ||
| North Dakota | ||
| Vermont | ||
| West Virginia |
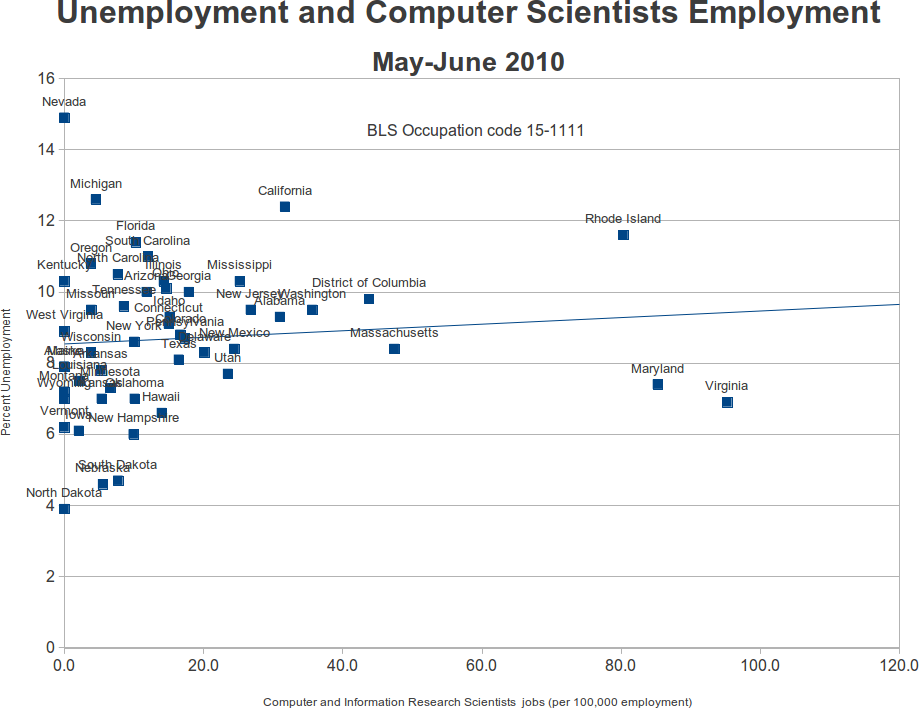
The following table compares the employment of Computer and Information Research Scientists to employment in all occupations. Five states have more than 40 jobs for Computer and Information Research Scientists per 100,000 employees: Virginia, Maryland, Rhode Island, Massachusetts and the District of Columbia.
| State | 15-1111, Computer and Information Research Scientists | All employment | 15-1111 per 100,000 employment |
| Virginia | 3,360 | 3,527,350 | 95.3 |
| Maryland | 2,100 | 2,462,470 | 85.3 |
| Rhode Island | 360 | 448,150 | 80.3 |
| Massachusetts | 1,480 | 3,119,100 | 47.4 |
| District of Columbia | 280 | 639,390 | 43.8 |
| Washington | 960 | 2,693,220 | 35.6 |
| California | 4,440 | 14,001,730 | 31.7 |
| Alabama | 560 | 1,807,480 | 31.0 |
| New Jersey | 1,010 | 3,770,550 | 26.8 |
| Mississippi | 270 | 1,070,820 | 25.2 |
| New Mexico | 190 | 777,560 | 24.4 |
| Utah | 270 | 1,148,520 | 23.5 |
| Delaware | 80 | 397,730 | 20.1 |
| Georgia | 670 | 3,744,740 | 17.9 |
| Pennsylvania | 950 | 5,483,220 | 17.3 |
| Colorado | 360 | 2,157,690 | 16.7 |
| Texas | 1,660 | 10,089,870 | 16.5 |
| Idaho | 90 | 594,750 | 15.1 |
| Connecticut | 240 | 1,598,640 | 15.0 |
| Ohio | 720 | 4,921,690 | 14.6 |
| Illinois | 790 | 5,528,420 | 14.3 |
| Hawaii | 80 | 571,630 | 14.0 |
| South Carolina | 210 | 1,746,820 | 12.0 |
| Arizona | 280 | 2,367,120 | 11.8 |
| Florida | 730 | 7,103,950 | 10.3 |
| Oklahoma | 150 | 1,483,760 | 10.1 |
| New York | 840 | 8,344,020 | 10.1 |
| New Hampshire | 60 | 603,420 | 9.9 |
| Tennessee | 220 | 2,569,420 | 8.6 |
| South Dakota | 30 | 387,590 | 7.7 |
| North Carolina | 290 | 3,772,780 | 7.7 |
| Minnesota | 170 | 2,562,450 | 6.6 |
| Nebraska | 50 | 901,690 | 5.5 |
| Kansas | 70 | 1,304,780 | 5.4 |
| Arkansas | 60 | 1,135,560 | 5.3 |
| Michigan | 170 | 3,755,890 | 4.5 |
| Missouri | 100 | 2,588,450 | 3.9 |
| Wisconsin | 100 | 2,608,740 | 3.8 |
| Oregon | 60 | 1,569,700 | 3.8 |
| Louisiana | 40 | 1,832,830 | 2.2 |
| Iowa | 30 | 1,438,510 | 2.1 |
| Alaska | 308,050 | 0.0 | |
| Indiana | ** | 2,724,850 | |
| Kentucky | 1,716,060 | 0.0 | |
| Maine | 577,410 | 0.0 | |
| Montana | 424,300 | 0.0 | |
| Nevada | 1,113,530 | 0.0 | |
| North Dakota | 355,710 | 0.0 | |
| Vermont | 286,990 | 0.0 | |
| West Virginia | 688,170 | 0.0 | |
| Wyoming | 269,910 | 0.0 | |
| Guam | 59,560 | 0.0 | |
| Puerto Rico | 950,570 | 0.0 | |
| Virgin Islands | 42,700 | 0.0 |
I was curious has to how employment in this sector was correlated with state unemployment rates. This is the comparison for May-June 2010. The short answer is that the two series are not correlated. The R^2 for an OLS regression is just .01.
This is a BLS map of the location quotient[*] for occupation code 15-1111.
(*) The location quotient is the ratio of the area concentration of occupational employment to the national average concentration. A location quotient greater than one indicates the occupation has a higher share of employment than average, and a location quotient less than one indicates the occupation is less prevalent in the area than average.